Mastering Google Ads reporting is less about analyzing every available data point and more about connecting the metrics to clear business outcomes. By segmenting performance into visibility, engagement, and conversion tiers, marketers can quickly pinpoint bottlenecks and take targeted action—whether that means expanding negative keyword lists, refining ad messaging, or streamlining landing page user experiences. Rather than making knee-jitter reactions to daily performance swings, evaluating trends over 7-to-30-day windows allows for steady, data-backed optimization. Ultimately, the true value of a Google Ads report lies in its ability to strip away guesswork, helping you reallocate budget toward top-performing channels, reduce cost per acquisition, and scale revenue with precision.
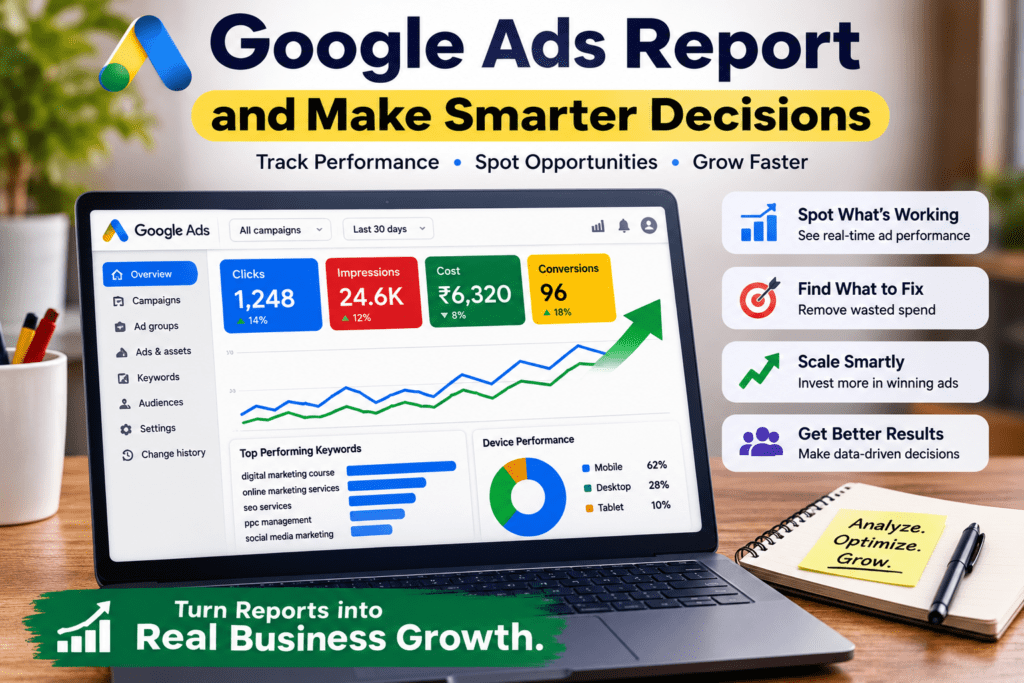
How to Read a Google Ads Report and Make Smarter Decisions
Opening up a Google Ads report can feel like staring at a matrix of endless numbers. Between CTR, CPC, CPA, ROAS, and Impression Share, it is easy to get overwhelmed by data overload.
However, running successful pay-per-click (PPC) campaigns isn’t about looking at every metric—it’s about knowing which numbers tell the story and what actions to take next.
This guide walks through how to decode your Google Ads reports, identify hidden opportunities, and turn raw data into profitable decisions.
1. Group Your Metrics by Objective
Not all metrics are created equal. To avoid getting lost in the weeds, divide your key performance indicators (KPIs) into three distinct tiers: Visibility, Engagement, and Conversion/Profitability.
| Tier | Primary Metrics | What It Measures | When to Focus Here |
| Visibility | Impressions, Search Impression Share | How many people are seeing your ads. | Brand awareness, market reach, campaign scale. |
| Engagement | Clicks, Click-Through Rate (CTR), Average CPC | How well your ad copy resonates with searchers. | Testing ad copy, match types, and creative relevance. |
| Conversion | Conversions, Cost per Acquisition (CPA), ROAS | How efficiently your budget generates business value. | Optimizing ROI, scaling spend, lead generation/eCommerce. |
2. The 3 Essential Reports to Check Every Week
Rather than scrolling endlessly through campaign dashboards, focus on these three core reports to spot waste and unlock potential:
A. The Search Terms Report
What it shows: The exact search queries users typed before clicking your ad (not just the keywords you bid on).
Actionable decision: Look for irrelevant search terms that consumed spend without converting, and add them as Negative Keywords to stop wasting budget. Conversely, add high-performing search queries as new dedicated keywords.
B. Campaign & Ad Group Performance
What it shows: High-level performance across different themes, products, or services.
Actionable decision: Shift budget away from underperforming ad groups to campaigns generating conversions at a lower CPA.
C. Auction Insights Report
What it shows: How your ads stack up against competitors bidding on the same keyword space.
Actionable decision: If competitors are outranking you or dominating top-of-page placement, review your Quality Score or consider raising bids on high-intent terms.
3. A Quick Diagnostic Framework for Smarter Decisions
Scenario 1: High Impressions, but Low CTR
Diagnosis: Your ads are showing, but users aren’t interested in clicking.
Fix:
Rewrite ad headlines to match search intent more closely.
Add ad assets (sitelinks, callouts, structured snippets) to increase physical ad real estate.
Refine keyword match types to ensure your ads appear for relevant searches.
Scenario 2: High Clicks, but Low Conversions
Diagnosis: Your ad messaging attracts interest, but the post-click experience isn’t converting.
Fix:
Ensure message match: Does the offer in your ad headline match the headline on your landing page?
Check page speed, mobile UX, and form complexity.
Review conversion tracking setup to confirm actions are being recorded properly.
Scenario 3: High CPA / Declining ROAS
Diagnosis: Your ads are generating sales or leads, but the cost to acquire them is destroying margins.
Fix:
Trim wasteful spending via negative keywords and lower bids on broad match terms.
Implement Automated Bidding strategies (e.g., Target CPA or Target ROAS) with sufficient conversion history.
Pause keywords with high spend and 0 conversions over the last 30–60 days.
4. Key Takeaway
Reading a Google Ads report isn’t about reacting to daily fluctuations; it’s about identifying patterns over time and taking structured, data-driven actions. Start by auditing your search terms weekly, fixing post-click friction, and continuously reallocating budget toward what drives real return on investment
Conclusion
Turning raw Google Ads data into actionable strategy is the single most effective way to maximize campaign return on investment. Viewing reports through a structured framework shifts the focus from vanity metrics to real, bottom-line results. By routinely auditing search terms, optimizing post-click journeys, and testing ad performance, you build a resilient, high-converting PPC system that turns every advertising dollar into a smarter business decision.